Every year the IMF and the World Bank hold a conference-style event that is referred to as the Spring Meetings. These Spring Meetings bring together central bankers, ministers of finance and development, private sector executives and academics to discuss global issues such as global economy, international development, and the world’s financial markets.
This year I had the opportunity to attend the 2018 Spring Meetings where discussions were held about threats and opportunities of technological changes as it affects global economies and policies. Here are 2 takeaways from the 2018 Spring Meetings focused on technology and innovation including some of my related articles:
Technological Changes → Job loss → Re-skill → New Jobs
Some jobs will never be recovered
The flow of technology and expertise doesn’t flow easily across countries
Even within countries, technological impacts are uneven causing inequality
A good balance between data privacy and business models is needed that benefits societies at a larger scale
Depending upon where innovation (internal or external) to the organizations is can impact society at different levels
A good balance of foundations and advance education is needed
Specialized knowledge can negatively impact holistic societal impacts
Artificial Intelligence (AI)
Dystopian Views: AI will take over most human activities and would rule over humans
Middle Ground Views: AI will augment and enhance human activities but never replace humans
Utopian Views: AI will take over most human activities that would free up time for humans to do other things
The Brave New World of Data
Data quality issues are borderless
Standard data definitions of economic data has to be agreed upon and used
Data is being used to build economic policies
Data is being used to create multinational economic blocs
Data is being used to assess the humming of the global economy
Data Standardization and Harmonization àData Transparency àData Accountability
PARTNERSHIPS
For economic prosperity, no organization, country, region is an island in of itself
Bridges need to be created across, public, private, academic, non-profit and shareholders
Regulations are slow to adapt to technological advancements and can be too heavy-handed or light-touch if not properly understood by policymakers
Grassroots changes are affecting how governments function and adapt
Technology and innovation should have executive level consideration across all branches of government and not just a ministry or a few people
Bonus: IMF’s Innovation Lab (iLab)
IMF has created the iLab whose goal seems to be to look at how technology and innovation are affecting the global economy and economic policies in various countries.
This article proposes looking at Predictive Analytics from a conceptual standpoint before jumping into the technical execution considerations. For the implementation aspect, organizations need to assess the following keeping in mind the contextual variances:
Strategies
Tactics
Operations
Top Down
Bottom-Up
Hybrid
Organizational Maturity
Change Management
Training
Practical Implications
Pros and Cons of Technology Infrastructure
Providing Enabling Tools to Users
Best Practices
Describing Predictive Analytics
Predictive Analytics is a branch of data mining that helps predict probabilities and trends. It is a broad term describing a variety of statistical and analytical techniques used to develop models that predict future events or behaviors. The form of these predictive models varies, depending on the behavior or event that they are predicting. Due to the massive amount of data organizations are collecting, they are turning towards Predictive Analytics to find patterns in this data that could be used to predict future trends. While no data is perfect in predicting what the future may hold there are certain areas where organizations are utilizing statistical techniques supported by information systems at strategic, tactical and operational levels to change their organizations. Some examples of where Predictive Analytics is leveraged include customer attrition, recruitment and supply chain management.
Gartner describes Predictive Analytics as any approach to data mining with four attributes:
Emphasis on prediction (rather than description, classification or clustering)
The rapid analysis measured in hours or days (rather than stereotypical months of traditional data mining)
An emphasis on the business relevance of the resulting insights (no ivory tower analyses)
An (increasing) emphasis on ease of use, thus making tools accessible to business users
The above description highlights some important aspects for organizations to consider namely:
More focus on prediction rather than just information collection and organization. Sometimes in organizations, it is observed that information collection becomes the end goal rather than using that information to make decisions.
Timeliness is important otherwise organizations might be making decisions on information that is already obsolete.
Understanding of the end goal is crucial by asking why Predictive Analytics is being pursued and what value it brings to the organization.
Keeping in mind that if the tools are more accessible to business users then they would have a higher degree of appreciation of what Predictive Analytics could help them achieve.
Relationship of Predictive Analytics with Decision Support Systems or Business Intelligence
The University of Pittsburg describes Decision Support Systems as interactive, computer-based systems that aid users in judgment and choice activities. They provide data storage and retrieval but enhance the traditional information access and retrieval functions with support for model building and model-based reasoning. They support framing, modeling and problem-solving. While Business Intelligence according to Gartner is an umbrella term that includes the applications, infrastructure and tools, and best practices that enable access to and analysis of information to improve and optimize decisions and performance. These descriptions point to the fact that Decision Support Systems or Business Intelligence are used for decision making within the organization.
Interestingly, it seems like Predictive Analytics is the underlying engine for Decision Support Systems or Business Intelligence. What this means is the predictive models that result in Predictive Analytics could be under the hood of Decision Support Systems or Business Intelligence. It should be noted that organizations should proceed with caution with regards to the Decision Support Systems or Business Intelligence since if the underlying assumption is incorrect in making the predictive models then the decision-making tools would be more harmful then helpful. A balanced approach would be to create expert systems where Decision Support Systems or Business Intelligence is augmented by human judgment and the underlying models are checked and verified periodically.
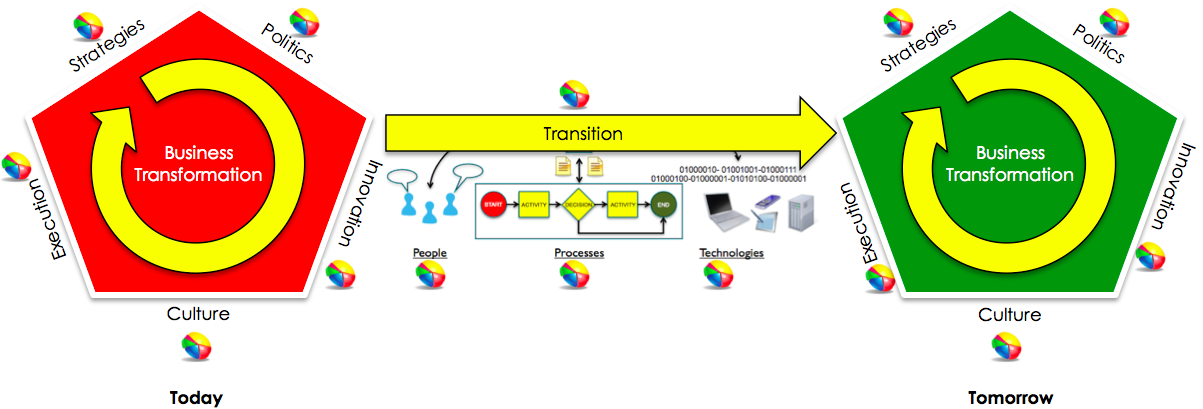
Implementation Considerations for Predictive Analytics
As the descriptions above have indicated that the aim of Predictive Analytics is to recognize patterns and trends that can be utilized to transform the organization. This requires organizations to first educate themselves on what value they want and what can be derived from Predictive Analytics. Predictive Analytics is about business transformation and it needs to show what value it brings to the organization. In this regard, we have to assess people, processes and technologies of the organization in terms of the current state (where the organization is right now) and future state (where the organization wants to be). Typically, this revolves around Strategies, Politics, Innovation, Culture and Execution (SPICE) as shown below.
SPICE Factors
The assessment of people for Predictive Analytics means understanding what users will be leveraging Predictive Analytics and if they understand that simply relying on Predictive Analytics is not enough but in order to have an effective system, they need to be part of the system. This means that analytics insights need to be augmented by human expertise to make intelligent decisions. The assessment of processes for Predictive Analytics entails looking at how organizations make decisions right now and how future decisions would be made if Predictive Analytics is put into place. This includes having appropriate governance structures in place. The assessment of technology entails looking at what technologies exist within the organization and if they could be leveraged for Predictive Analytics. If not then looking at what Predictive Analytics products are in the market that would work for the organization and are they flexible enough in case the underlying assumptions for the predictive models change and when predictive models become obsolete.
The advanced techniques mentioned in the book, Seven Methods for Transforming Corporate Data into Business Intelligence would be applicable to Predictive Analytics. These methods are:
Data-driven decision support
Genetic Algorithms
Neural Networks
Rule-Based Systems
Fuzzy Logic
Case-Based Reasoning
Machine Learning
Technologies Used for Predictive Analytics
Gartner has been publishing its Magic Quadrant on Business Intelligence and Analytics Platforms since 2006. Due to the increased importance of Predictive Analytics in the marketplace, Gartner decided to create a separate Magic Quadrant for Advanced Analytics Platforms which focuses on Predictive Analytics and published its first version in February 2014. Since it is the first version of the Magic Quadrant, all vendors listed are new and no vendors were dropped.
Gartner’s Magic Quadrant for Advanced Analytics Platforms
As we can see from this Magic Quadrant that it includes well-known vendors but also vendors that are not as big or as well-known. It is interesting to note that open-source vendors such as RapidMiner (a Chicago company) and Knime (a European company) are in the same Leaders Quadrant as well-established vendors such as SAS and IBM. While there are some issues with these open-source vendors as stated in the report but perhaps this Magic Quadrant is also an indication of where the next generation of analytics would come from. Due to the very nature of open-source, there are more opportunities for cheaper customization which would give the organizations the flexibility to be as granular as they want to be. Of course code stability and lack of proper documentation are issues that organizations need to be cognizant about. Organizations may also want to “try-out” these open source tools before they make a big commitment to proprietary software to see if Predictive Analytics is something they want to invest heavily in.
Using Predictive Analytics in Specific Industries
There are many industries that utilize Predictive Analytics. The organizations in these industries either use Predictive Analytics to transform their business and/or to address certain areas that they would like to improve upon. Following is a list of some of the industries that utilize Predictive Analytics:
Industry
How is Predictive Analytics used?
Retail
Customer Retention
Inventory Optimization
Low-Cost Promotions
Oil and Gas
Well and Field Asset Surveillance
Production Optimization
Equipment Reliability and Maintenance
Automotive
Adjust production schedules
Tweak marketing campaigns
Minimize Inventory
Food
Human Resources Allocation
Supply Chain Optimization
Healthcare
Electronic Health Records
Government
Nation-wide Blood Levels
Social Media
New Business Models
While there are many examples of industries that have embraced Predictive Analytics but there are other industries that have not fully accepted it as a new reality. These industries have many excuses for not considering Predictive Analytics but typically revolve around scope, quality, cost, and fear of the known. However, the tide might be changing for these industries as well since industry bloggers are beginning to insist on how Predictive Analytics could be leveraged for competitive advantages.
My Opinion
Predictive Analytics can come in handy in making organizations analytical and becoming a better version of themselves. However, Predictive Analytics can be a deal-breaker if organizations have attempted and failed in the past and for this very reason, Predictive Analytics should start as a discussion first. This discussion should revolve around asking which areas need improvements and among other things determine if Predictive Analytics could be something that could help. After a successful Predictive Analytics initiative, other areas could be potential candidates as well.
An important thing to note is that Predictive Analytics is an organization-wide initiative that has touchpoints across the organization and thus the maturity of the organization has to be seriously considered prior to go on a Predictive Analytics journey. No matter how good Predictive Analytics can be for the organization but if the organization is not mature enough and it does not have the right governance, processes and feedback mechanisms in place then it might turn out to be another attempt at glory but nothing to show for it.
In statistics, a hypothesis is proposed and then data samples are collected to prove or disprove the hypothesis with acceptable confidence levels. For example, let’s say that all our customers are aware of all our product lines. Basically, there are two ways of assessing our hypothesis that includes: (1) Proving our hypothesis and (2) Disproving our hypothesis.
The first way to proving our hypothesis is that we communicate with all of our customers and inquire if they know all our product lines. The second way is to communicate with as many customers as possible until we come across any customer that does not know all our product lines. From this example, we can see that if we find even one customer then that disproves our hypothesis. Thus, this is the reason why in statistics, sometimes it is easier to find an exception to disproving a hypothesis rather than proving it.
Big Data, on the other hand, inverts the generally acceptable process from hypothesis then data sample collection to data collection then a hypothesis. What this means is that Big Data emphasizes collecting data first and then coming up with a hypothesis based on patterns found in the data. Generally speaking, when we talk about Big Data, we are concerned with the 3 Vs that include:
Volume – Amount of data
Velocity – Rate of data analysis
Variety – Different data sources
Some have indicated that we need to go beyond just the above three Vs and should also include:
Viscosity – Resistance to the flow of data
Variability – Changes in the flow changes of data
Veracity – Outlier data
Volatility – Validity of the data
Virality – Speed at which data is shared
I would take the Big Data concept a bit further and introduce:
Vitality – General and specific importance of the data itself
Versatility – Applicability of data to various situations
Vocality – Supporters of data-driven approaches
Veto – The ultimate authority to accept or reject Big Data conclusions
For a metrics-driven organization, a possible way to determine the effectiveness of your Big Data initiatives is to do a weighted rating of the Vs based on your organizational priorities. These organizational priorities can range from but not limited to increasing employee retention rates, improving customer experiences, improving mergers and acquisitions activities, making better investment decisions, effectively managing the organization, increasing market share, improving citizens services, faster software development, improving the design, becoming more innovative and improving lives. What all of this means is that data is not just data but it is, in fact, an organization’s most important asset after its people. Since data is now a competitive asset, let’s explore some of the ways we can use it:
Monte Carlo Simulations – Determine a range of scenarios of outcomes and their probabilities.
Analysis of Variance (ANOVA) – Determine if our results change when we change the data
Regression – Determine if data is related and can be used for forecasting
Seasonality – Determine if data shows the same thing occurring at the same intervals
Optimization – Getting the best possible answer from the data
Satisficing – Getting a good enough answer from the data
Now that we understand what is Big Data and how it can be used, let’s ask the following questions:
Today
Tomorrow
Who is capturing data?
Who should be capturing data?
What is the lifecycle of your data?
What should be the lifecycle of your data?
Where is data being captured?
Where should data be captured?
When is data available for analysis?
When should data be available for analysis?
Why data is being analyzed?
Why data should be analyzed?
Having discussed the positives of Big Data, we have to realize that it is not a panacea and has its negatives as well. Some of the negative ways data can lead to bad decisions include: (1) Data is correlated but that does not imply cause and effect, (2) Data shows you pretty pictures but that does not imply it is telling you the truth and (3) Biases can affect data anywhere from capturing to analysis to decision-making.
In conclusion, what this means is that the non-distorted quality, understanding, and usage of data is the difference between just getting on the Big Data bandwagon or truly understanding how data can fundamentally change your organization.
It seems like in today’s world people and organizations are somewhat struggling with this big data concept and do not know where to begin. Due to this reason, they are collecting everything they can think of in the hopes that one day they will be able to use this data in a meaningful way such as better customer experience, new products/services, better collaboration, increasing revenue, etc. This hope approach of “let’s collect data and later decide what we can use it for” on the surface might seem sound but last I checked hope is not a strategy. Perhaps this is one of the reasons that even now only <1% of the data collected is actually being analyzed. What good is more data when one cannot even make sense of the other 99%+ of data it already has? Are we chasing a ghost?
While it is true that vast amounts of data are and will be generated from financial transactions, medical records, mobile phones, and social media to the Internet of Things but there are questions that need to be asked to understand data’s meaningful use:
How will data be managed?
How will data be shared?
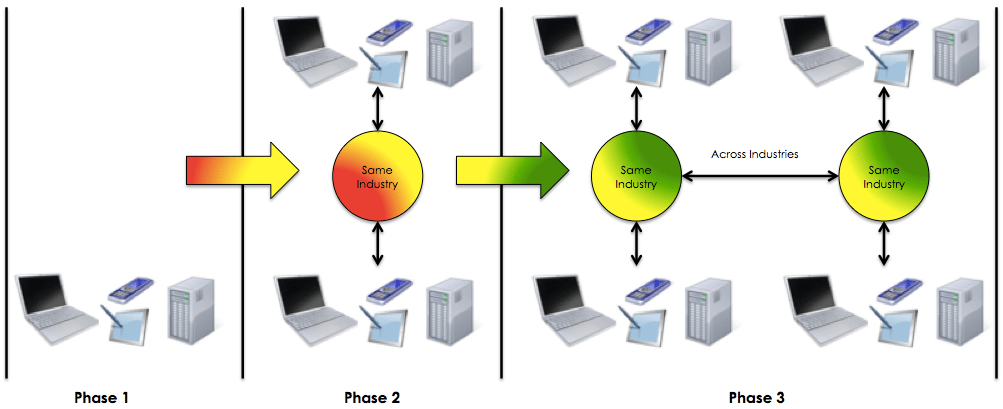
I believe that in order to come to a point where data becomes meaningful and useful it would require (broadly speaking) three phases:
Establishment of standards, governance, guidelines. (E.g., open architectures)
Creation of industry specific data exchanges. (E.g., healthcare data exchanges, environment data exchanges, etc.)
Creation of cross-industry data exchanges. (E.g., healthcare data exchanges seamlessly interacting with environmental data exchanges, etc.)
Additionally, let’s keep this in mind that the data we are talking about is data that can be captured by current tools and systems but the data which is perhaps the most difficult to capture is unstructured human data which within organizations is called Institutional Knowledge. This does not reside in a document or a system but in the minds of the people of an organization who understand what needs to be done in order to move things forward.
So, the question becomes, do we really need Data Scientists who have a mix of coding skills with PhDs in scientific disciplines and business sense or do we need someone who is able to connect the dots and have the ability to create the future. The answer is not a simple one. Perhaps you need both. The ability to code should not be the deciding factor but rather the ability to leverage technology and data should be. I agree that there is a shortage of people with diverse talent but there is also a shortage of people who actually know how to leverage this kind of talent.
Before organizations go on a hiring spree they should consider:
Why do they need a Data Scientist? (E.g., have strategic intent, jumping on the bandwagon, etc.)
Who will the Data Scientist report to? (E.g., Board, CEO, CFO, COO, CIO, etc.)
Does the organization have the ability to enhance/change its business model? (E.g., making customers happy, leading employees, etc.)
Is the Data Scientist really an IT person with advanced skills or does s/he have advanced skills and happens to know how to leverage technology and data?
How often will you measure the relevancy of the data? (E.g., key data indicators)


You must be logged in to post a comment.